Dynamics 365 Business Central Reporting Series: Financial Reports
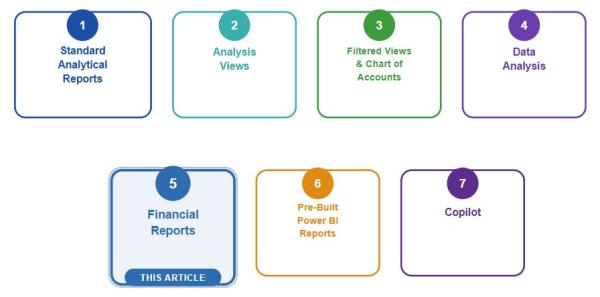
In this series, we have been exploring the reporting options available in Microsoft Dynamics 365 Business Central, starting with the foundational question: how do you choose the right tool? If you missed the earlier articles, you can catch up here:
- Intro Article – Choosing the Right Option
- Article 1 – Standard Analytical Reports
- Article 2 – Analysis Views
- Article 3 – Filtered Views
- Article 4 – Data Analysis Mode
In this installment, we explore one of Business Central's most essential and continuously improving reporting tools: Financial Reports. This is the purpose-built feature for designing and running financial statements, with no exporting to Excel, no third-party add-on, and no developer required. Whether you need an Income Statement, a Balance Sheet, a budget-to-actual comparison, or a report broken out by department, location, or another dimension, Financial Reports gives you a flexible, repeatable, and audit-friendly way to get there directly within Business Central.
Note: Some screenshots in this article — including those illustrating recent Financial Reporting improvements — are sourced from Microsoft's release wave presentation materials.
What are they?
Financial Reports are Business Central's dedicated feature for designing and running financial statements. They replaced the older Account Schedules and are now the standard place to build an Income Statement, Balance Sheet, Cash Flow Statement, Statement of Retained Earnings, and anything else that pulls from the Chart of Accounts.
Microsoft's official description sums it up well: "The Financial Reports feature gives you insights into the financial data shown on your chart of accounts. You can set up financial reports to analyze figures in general ledger accounts and compare general ledger entries with budget entries. The number of financial reports you can create is unlimited and requires no involvement of a developer."
Every Financial Report is built from two required building blocks, plus one optional one:
- Row Definition (required): defines the accounts or account groupings that appear down the page, such as Revenue, Cost of Goods Sold, or Operating Expenses.
- Column Definition (required): defines what appears across the page, such as Actual, Budget, or a specific period comparison.
- Analysis View (optional:) lets you pull in additional dimensions as needed for reporting, like Business Unit, Department, or Site, so the report can be sliced beyond the base Chart of Accounts structure.
Together, the row and column definitions form the foundation of the report, and the analysis view adds an optional layer of dimensional detail on top. Budget comparison isn't a separate feature. It's simply another column type, which is what makes actual-vs-budget reporting so easy to build once the row and column structures are in place.

How do I find them?
There are different paths to get there, depending on the Role/Profile being used.
FREE Membership Required to View Full Content:
Joining MSDynamicsWorld.com gives you free, unlimited access to news, analysis, white papers, case studies, product brochures, and more. You can also receive periodic email newsletters with the latest relevant articles and content updates.
Learn more about us here