New Dynamics 365 Business Central Reporting Series: Your Guide to Choosing the Right Option
Business Central offers a variety of powerful reporting options, which provide tremendous flexibility. With at least seven distinct ways to view your data, each is designed for a different question, audience, and use case. The challenge is knowing which option is the right fit.
Over the past two years, I have presented to customers and at conferences about the different reporting options available in Business Central and when to use each one. The feedback has consistently shown that many users are not aware of all the reporting options available or which one is most appropriate for a given scenario.
In this new article series, we will explore all seven reporting approaches, one article at a time. This first article serves as a roadmap, introducing each option, who it is designed for, and when to use it. Future articles will take a deeper dive into each reporting option.
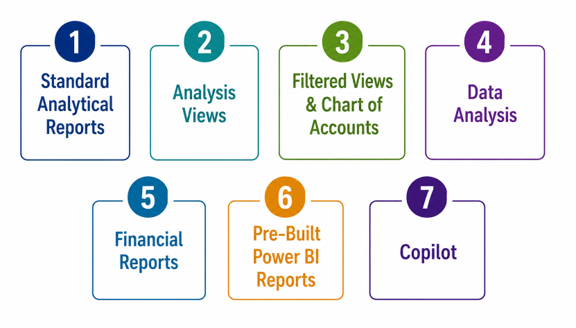
Let’s start with an overview of the reporting options, in the order in which we will cover them:
- Standard Analytical Reports - the classic BC reports, now with Excel layouts.
- Analysis Views - slice the general ledger by dimensions or periods (not the same thing as Data Analysis!).
- Filtered Views on lists and the Chart of Accounts - saved filters for everyday questions and easy access to financial figures.
- Data Analysis mode - in-page pivot and analysis on any list, no export needed.
- Financial Reports – producing financial reports such as the Income Statement, Balance Sheet, Cash Flow.
- Pre-Built Power BI Reports - ready-made dashboards Microsoft makes available with BC.
- Copilot - ask Business Central, in plain English, where to look or what to do, and pivot data easily.
Match the report to the audience
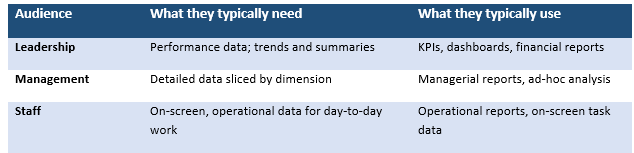
A useful way to choose the right tool is to think about who will consume the information. Leadership typically wants high level KPIs and trends. Management often needs comparative, dimensional analysis. Staff rely on detailed lists and on-screen data to support their day-to-day work.
An easy visual way to think about this is the reporting pyramid from Microsoft, which shows how information flows from detailed data at the operational level up to summarized insights for leadership.

What’s coming next
Each of the next seven articles focuses on one reporting option in Business Central and breaks it down using three simple questions:
- What is it?
- Where do I find it?
- When should I use it?
Each article will include practical examples and screenshots directly from Business Central to make it easy to follow.
By the end of the series, you will be able to open Business Central and quickly determine which reporting option best fits the question in front of you.
FREE Membership Required to View Full Content:
Joining MSDynamicsWorld.com gives you free, unlimited access to news, analysis, white papers, case studies, product brochures, and more. You can also receive periodic email newsletters with the latest relevant articles and content updates.
Learn more about us here