Dynamics 365 Business Central Reporting Series: Standard Analytical Reports
In the first article of this series, we explored the different reporting options available in Microsoft Dynamics 365 Business Central and discussed why selecting the right reporting tool starts with understanding what questions you need to answer, who the audience is, and how they prefer to consume information.
In this article, we will take a closer look at Standard Analytical Reports, one of the foundational reporting tools available to Business Central users.
What are they?
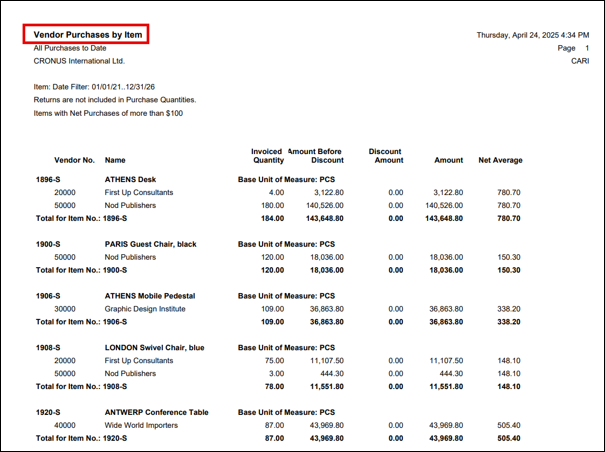
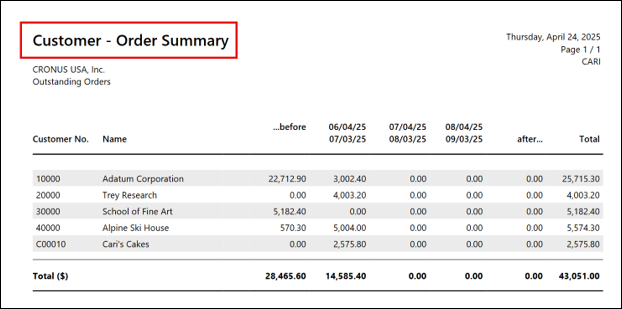
Standard Analytical Reports are the long-standing, built-in reports that ship with Business Central. They are designed, formatted, and ready to run. You pick filters, hit print or preview, and out comes a report. Think of Vendor Purchases by Item, Customer Order Summary, Aged Accounts Receivable, and dozens, if not hundreds, of others.
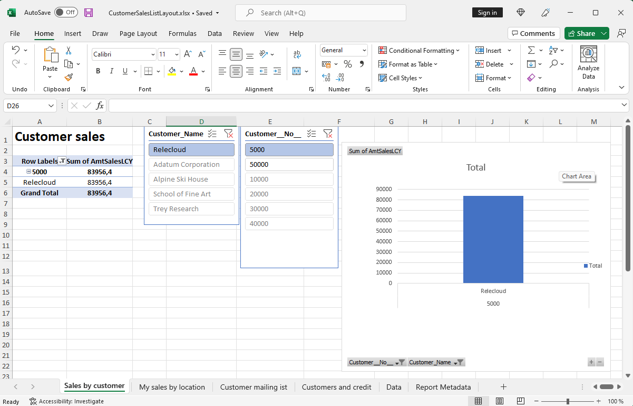
One of the biggest improvements in recent Business Central releases has been support for Excel layouts. Instead of being limited to the standard report format, users can design their own Excel output with tables, PivotTables, charts, formulas, conditional formatting, logos, and other custom formatting. The report still pulls the same Business Central data, but the presentation is completely customizable, making it easy to create reports that match your organization's needs without changing the underlying report logic.
How do I find them?
There are many ways to find Standard Analytical Reports, but here are three simple ones:
1. Reports & Analysis (Role Explorer)
From any Role Center, click the Role Explorer menu and choose Reports & Analysis. You’ll see reports grouped by functional area — Finance, Purchasing, Sales, Inventory, and so on.
FREE Membership Required to View Full Content:
Joining MSDynamicsWorld.com gives you free, unlimited access to news, analysis, white papers, case studies, product brochures, and more. You can also receive periodic email newsletters with the latest relevant articles and content updates.
Learn more about us here