How to See the Financial Logic of Dynamics 365 Business Central
Have you ever tried to explain to a user why, after an ordinary sale, Business Central created exactly those entries? Why did the amount go to one account, VAT to another, cost of goods sold to a third one, and inventory suddenly decrease somewhere deep inside the financial layer?
At first glance, it really does look like magic. The user sees a document: a sales order, a purchase invoice, a credit memo, an inventory movement. And in response, the system creates a set of G/L Entries, VAT Entries, Value Entries, and a few other related records. Everything seems to be correct. But why exactly this way?
And this is where it gets interesting. The financial core of Business Central is very solid. It has stood the test of time and lets you implement many different scenarios - trade, manufacturing, service, warehousing, financial operations, and complex tax models. But users still have a problem: seeing the meaning behind those rows.
So let’s try to look at Business Central finance from exactly this angle: not as a set of tables and settings, but as a living financial model that can be seen, explained, and checked.
A Document Is Only the Beginning of the Financial Story
When a user works with a document in Business Central, they usually think in terms of a business operation. Sold an item. Bought an item. Moved inventory. Made an adjustment. Applied a discount.
But for the financial layer, the document is not the final point. It is the source of an event. The system has to understand what exactly happened from an accounting perspective: did assets appear, did liabilities arise, should revenue be recognized, was cost of goods sold formed, did inventory change, did VAT appear?
Take a normal item sale. At the business level it sounds simple: we sold an item to a customer. But in finance, several things happen at the same time:
- accounts receivable appears;
- revenue is recognized;
- VAT is calculated;
- inventory decreases;
- cost of goods sold is posted;
- if there is a discount, it also gets its own financial reflection.
And this is still a simple example. In a real company, you may also have different warehouses, currencies, dimensions, tax settings, and different item and customer groups. That is why one operation at the document level turns into a set of connected financial entries.
For an experienced accountant or consultant, this is a connected accounting model. For a regular user, it is often just a set of rows that somehow needs to be interpreted.
But How Do We See It?
And yes, we can see it quite literally. We can both show entries as a list and visualize the movement of amounts between accounts. Which account increased? Which one decreased? By how much? And what does that mean for the company?
When accountants are trained, they are taught to draw financial accounts on paper as T-accounts: debit on the left, credit on the right, account name on top. But it is important to remember that debit and credit do not automatically mean "plus" and "minus" for every account in the same way.
If we connect accounts with lines and show how amounts move from one financial block to another, entries stop being abstract rows. They become a picture of the operation.
Let’s try it. Look at a regular sale - and not even the simplest one, because it includes a discount. Below is a Balance Sheet + Income Statement view, created using an extension I developed. (A link is at the end of this article.) This type of visualization is useful when you want to show how an operation lands in familiar financial reporting: where the balance sheet is, where the income statement is, where the assets, income, and expenses are.

In this picture, you can immediately see that a sale is not just one amount in a document. Accounts receivable increased. Revenue appeared in its own account. VAT went to liabilities. Inventory decreased. Cost of goods sold went to expenses. And the discount did not disappear inside the document line; it became a separate element of the financial story.
Note: I think discounts really should be tracked separately, on dedicated accounts. From a finance perspective, a discount is not just "we sold it cheaper". It is the price the company pays for customer loyalty, for volume, for retention, for a commercial decision. If you hide the discount inside revenue, part of that logic becomes less transparent.
And here the first important effect appears: the user literally sees not just the entries, but the meaning of the operation. In this case, the company became richer by 50.36. The user can understand what the company actually earned, where the receivable appeared, what happened to inventory, and how the discount affected the result.
The Same Operation, But from a Different Angle
But there is another way to look at the same sale - through the basic accounting equation: Assets = Liabilities + Equity.
This view is useful when we want to explain not so much the reporting format, but the economic meaning of the operation. What changed in assets? What liabilities appeared? How does the financial result ultimately affect equity?
In other words, we step away from the form of financial statements and return to the basic logic of accounting: every operation either changes the composition of assets, or the sources that finance them, or the financial result, which eventually affects the company’s equity.
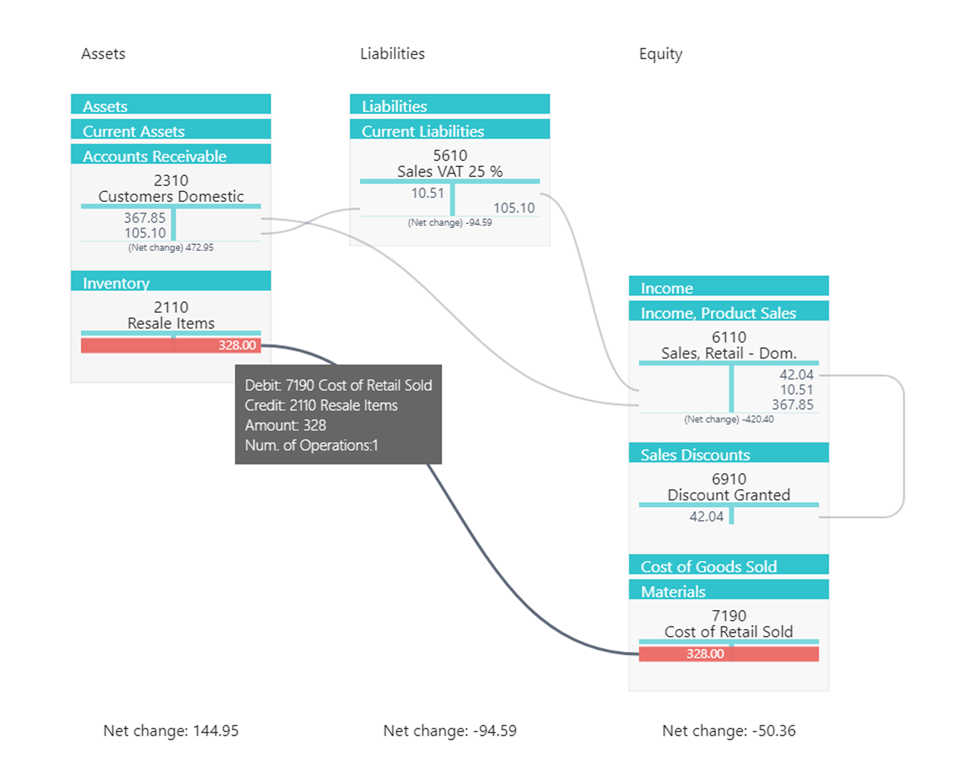
In my view, this is a very good way to talk to users who are not accountants. Instead of a long explanation of "debit here, credit there", you can show: here are the assets, here are the liabilities, here is the result of the operation. And it immediately becomes clearer what the sale actually changed.
FREE Membership Required to View Full Content:
Joining MSDynamicsWorld.com gives you free, unlimited access to news, analysis, white papers, case studies, product brochures, and more. You can also receive periodic email newsletters with the latest relevant articles and content updates.
Learn more about us here