Smarter Location Intelligence for Field Teams and Volunteers within Dynamics 365
Managing people in the field is rarely simple. Whether it is a sales team visiting customers or volunteers running outreach programs, coordination becomes complicated the moment geography enters the picture.
People are spread across different areas. Schedules change during the day. Travel time affects productivity. Managers often rely on spreadsheets, calls, and manual coordination just to keep operations moving.
Two very different professionals often face this same challenge.
One wants to visualize team performance and optimize daily routes.
The other wants to efficiently manage outreach programs and track volunteer locations.
At first glance, these situations seem unrelated. One belongs to the corporate world of sales and operations, while the other belongs to the social impact world of volunteer coordination.
But the underlying challenge is the same. Both need better visibility, smarter scheduling, and location-based decision making.
Location intelligence empowered with assets such as Auto Scheduling, Route Optimization, Real-Time Tracking, Analytical Dashboards, and Heat Maps can transform the way field work is managed.
When Field Teams Need Smarter Coordination
Consider the first scenario.
A field manager is responsible for a team that spends most of its time visiting customers, partners, or service locations. Every morning begins with the same challenge.
Which locations should each team member visit today?
Without proper tools, this process often involves manually reviewing customer records, estimating travel distances, and assigning visits based on assumptions.
This approach creates several inefficiencies.
- Sales representatives may travel long distances between appointments, even when customers are located close to each other.
- Teams may unknowingly revisit the same area multiple times during the week.
- Some regions may receive excessive attention while others remain untouched.
Over time, these inefficiencies affect productivity and revenue.
Instead of focusing on meaningful customer interactions, teams spend a large portion of their day navigating between locations.
Auto Scheduling for Balanced Field Operations
One of the most effective ways to solve this problem is through Auto Scheduling.
Auto Scheduling automatically assigns visits and tasks to field team members based on multiple factors such as location proximity, availability, and workload balance.
Instead of manually deciding which representative should visit which customer, the system analyzes the available data and generates optimized schedules.
This brings several benefits.
- First, workloads become more balanced. Every team member receives a manageable number of visits based on capacity.
- Second, geographical clustering improves. Customers located in the same area are grouped, reducing unnecessary travel.
- Third, managers save time. Instead of spending hours planning daily activities, schedules can be generated in minutes.
Auto Scheduling converts what was once a manual planning exercise into an intelligent system-driven process.
Route Optimization for Efficient Travel
Even with well-planned schedules, inefficient travel can still reduce productivity.
This is where Route Optimization becomes essential.
Route Optimization analyzes factors such as distance, road networks, and travel time to determine the most efficient sequence of visits.
Rather than leaving representatives to decide their own routes, the system suggests the best possible path between multiple locations.
The impact is immediate.
- Travel time decreases because unnecessary backtracking is eliminated.
- Fuel consumption reduces as driving distances shrink.
- Most importantly, field teams gain additional time that can be used for customer interactions.
For organizations managing large field teams, even small improvements in routing efficiency can produce significant operational gains.
A few minutes saved per visit quickly translates into hours of productivity across an entire team.
Real-Time Tracking for Better Visibility
Once field teams are deployed, managers often struggle with visibility.
- Where is each team member right now?
- Are visits being completed on time?
- Are there delays or unexpected changes?
Without real-time insight, managers rely on phone calls or end-of-day reports to understand what is happening on the ground.
Real-Time Tracking solves this challenge.
By visualizing the live location of field representatives on a map, managers can instantly see how operations are progressing throughout the day.
This visibility helps in several ways.
- Managers can identify delays early and make schedule adjustments when necessary.
- They can also support team members who may need assistance in unfamiliar areas or tricky situations.
Real-Time Tracking ensures that field operations remain transparent and adaptable.
When Volunteer Networks Need Better Coordination
Now consider the second persona.
Instead of managing sales representatives, this person coordinates volunteers for outreach programs.
These programs may involve community support, disaster relief, educational campaigns, or environmental initiatives.
Volunteers are often spread across different locations, and their availability may vary throughout the day.
The coordinator needs to answer several important questions.
- Which areas have the highest concentration of volunteers?
- Which regions still need support?
- How active are volunteers in different communities?
Without visual tools, answering these questions becomes difficult.
Volunteer data may exist in spreadsheets or CRM records, but it is hard to understand the geographical distribution of activity.
Analytical Dashboards for Performance Insights
This is where Analytical Dashboards become valuable.
Analytical Dashboards consolidate field data into visual reports that help managers understand performance trends.
For volunteer coordinators, dashboards can reveal patterns such as:
- Volunteer activity levels across different regions
- Number of outreach visits scheduled and completed
- Areas with higher engagement or participation
These insights help organizations make informed decisions about where to allocate resources.
For example, if one region shows high volunteer engagement while another shows limited activity, coordinators can adjust outreach strategies accordingly.
Dashboards transform raw data into meaningful insights that guide better planning.
Heat Maps for Identifying Impact Areas
Another powerful tool for outreach coordination is Heat Maps.
Heat Maps visually represent data density across geographic areas. Instead of viewing individual records, managers can see patterns of activity across entire regions.
For volunteer programs, Heat Maps can highlight:
- Communities with strong volunteer presence
- Regions where outreach efforts are concentrated
- Areas that require additional attention
This visual representation makes it easier to identify impact zones and coverage gaps.
For example, if a heat map reveals a cluster of volunteers in one neighborhood but limited activity in nearby areas, coordinators can redirect efforts to balance outreach.
Heat Maps provide a strategic perspective that is difficult to achieve through traditional reports.
Proximity Search to target locally
Radius or Proximity Search helps find potential volunteers in nearby areas, making outreach easier, more convenient, and faster.
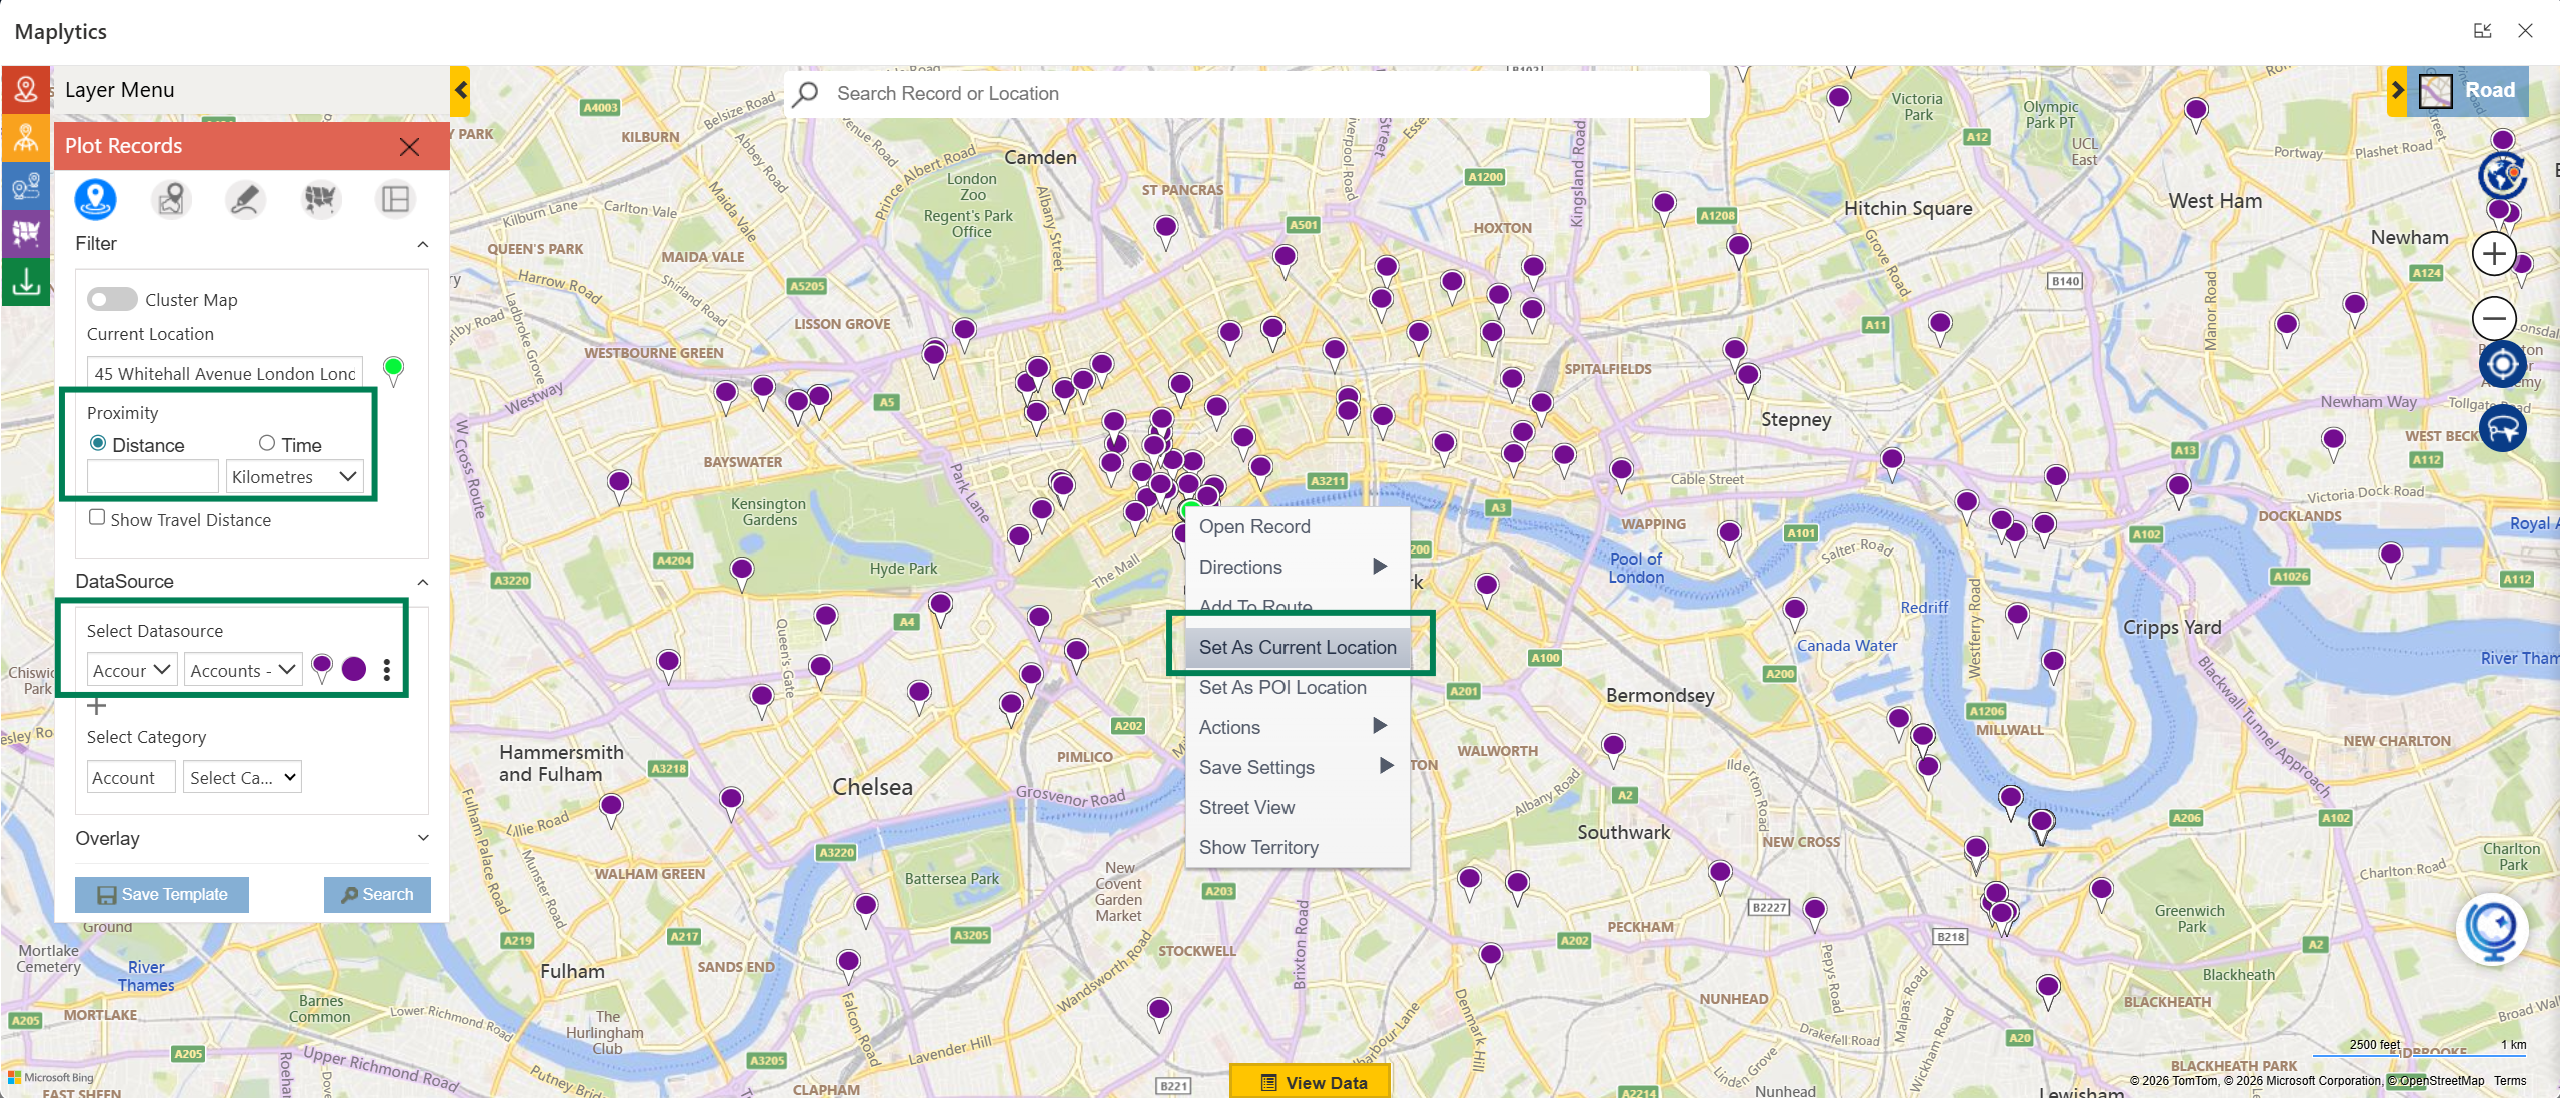
Why invest in travel plans and travel time when the opportunities lie nearby?
Bridging Two Worlds with Location Intelligence
Although the two personas operate in different environments, their needs are surprisingly similar.
Both require better ways to coordinate people, manage time, and understand geographical patterns.
Location intelligence bridges this gap.
Auto Scheduling ensures that daily tasks are distributed efficiently. Route Optimization minimizes travel inefficiencies. Real-Time Tracking provides operational visibility. Analytical Dashboards reveal performance trends. Heat Maps highlight geographic patterns. Together, these tools create a comprehensive system for managing field-based operations.
All these powerful assets or features can be leveraged within Dynamics 365 using Maplytics. This flagship of Inogic is a certified geo-analytical application on the Microsoft Marketplace and empowers its users with not just these features but also Territory Management, Census Data Visualization, ESRI Overlays, Mobile Integrations, and a lot more. Maplytics, with its features, is available for Dynamics 365, Power Apps, Power Pages, and Dataverse. Organizations interested in adoption, 15-day free trials, or personalized demos are encouraged to contact Maplytics’ sales team at [email protected]