Enhancing Views With Charts in Dynamics 365 CRM
FREE Membership Required to View Full Content:
Joining MSDynamicsWorld.com gives you free, unlimited access to news, analysis, white papers, case studies, product brochures, and more. You can also receive periodic email newsletters with the latest relevant articles and content updates.
Learn more about us here
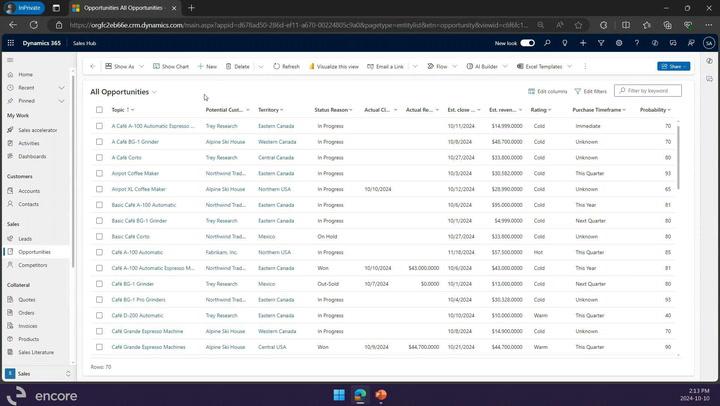
In this video, we show you how to use charts in Dynamics 365 CRM to filter data, replacing multiple saved views with a single "All Opportunities" view. By selecting "Opportunity by Status" and clicking on parts of the chart, you can quickly filter records with just one click.
We'll also demonstrate further filtering by territory and rating, and how to use charts for aggregate information like estimated revenue. You can expand charts for a larger view and easily incorporate them into presentations.
Explore the available charts in Dynamics 365 CRM and start using them today to streamline your data filtering and gain quick insights.
Encore Business Solutions is a trusted Microsoft Dynamics 365 Partner, serving over 800 clients across North America with ERP and CRM solutions.