10 Tips & Tricks for CRM Data Visualization and Relationship Mapping in Dynamics 365
Your CRM holds a goldmine of relationship data, accounts, contacts, opportunities, hierarchies, and connections. But if that data lives in rows, forms, and list views, it stays invisible. The real competitive edge comes when you can see it.
Here are 10 practical tips for better CRM data visualization and relationship mapping in Dynamics 365, and how Map My Relationships helps you put each one into action.
Key takeaways:
- See relationships visually: Switch from list views to interactive maps for instant clarity on who's connected to whom.
- Map stakeholders early: Visualize decision-makers and account hierarchies before engaging to avoid costly blind spots.
- Act directly from the map: Update, share, and manage CRM data without ever switching screens.
1. Stop Reading CRM Data — Start Seeing It
List views and form-based navigation were designed for data entry, not relationship understanding. If your team is scrolling through records to figure out who's connected to whom, you're wasting time and missing context.
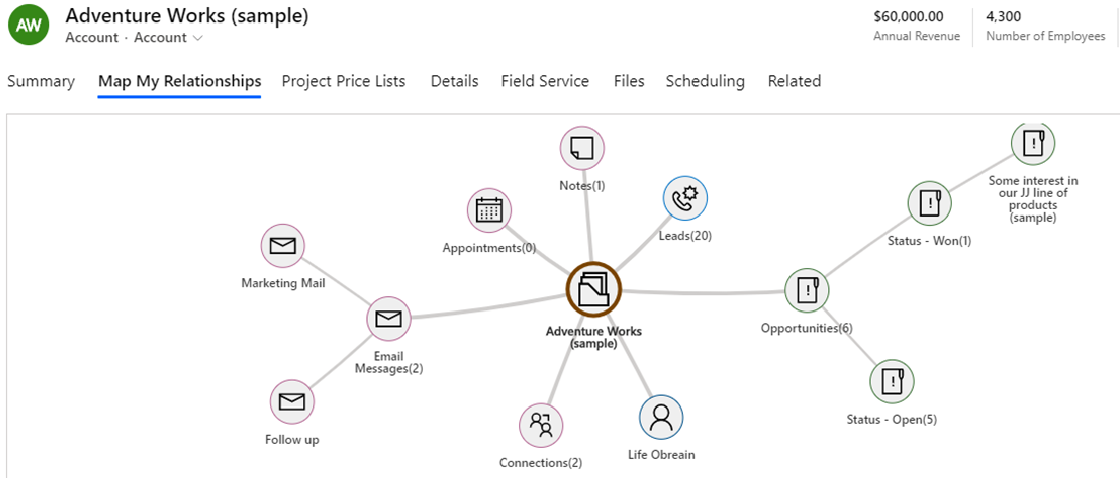
Tip: Switch to a mind map view in Dynamics 365 to get an instant visual overview of all records connected to an account, contacts, opportunities, activities, and custom entities, on a single, interactive canvas. What takes minutes of clicking takes seconds of scanning.
2. Map Stakeholders Before You Enter a Deal
B2B deals rarely involve one decision-maker. Entering a sales cycle without a clear stakeholder map is like navigating without a map. Influence mapping in Dynamics 365 helps you visualize who holds budget authority, who influences the decision, and who might be a blocker, before your first call.
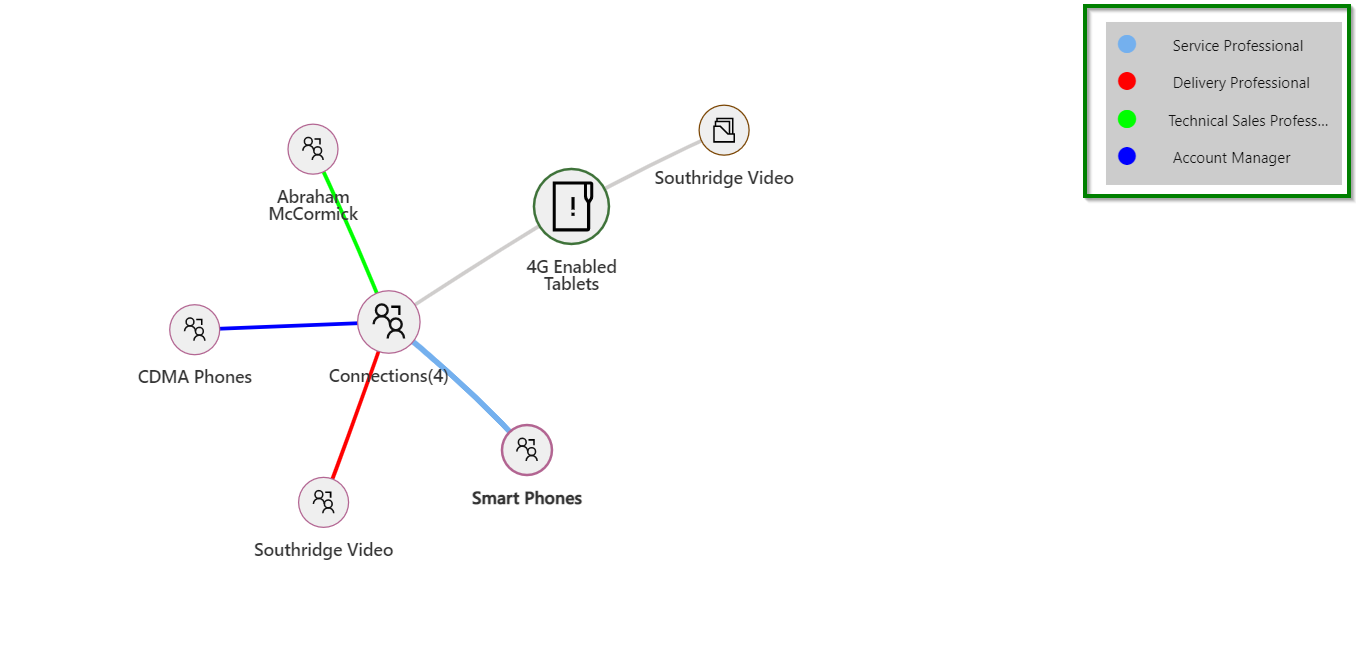
Tip: Build your stakeholder relationship map at the opportunity stage. Use color-coded connections to tag each contact by role, Champion, Decision-Maker, Influencer, or Risk, so the whole team is aligned on the relationship landscape from day one.
3. Replace Org Charts Built Outside CRM with Hierarchy Views Inside It
Most teams maintain org charts in PowerPoint or Visio, completely disconnected from live CRM data. This means they're almost always outdated.
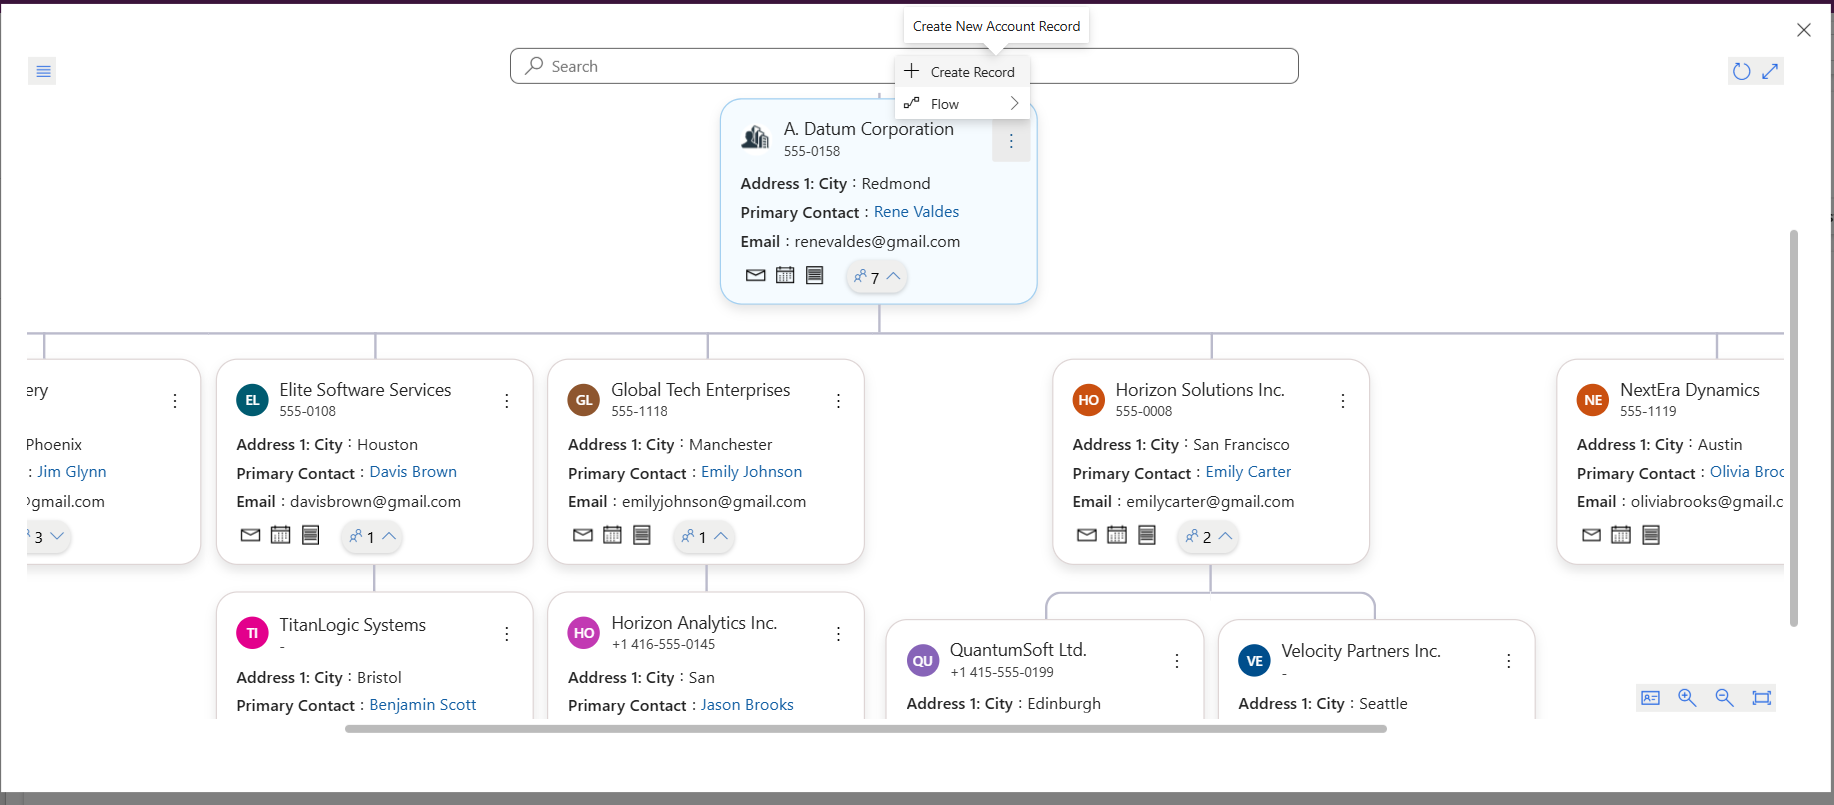
Tip: Use the org chart and hierarchy control in Dynamics 365 to visualize parent-child account structures directly from your CRM records. When a contact changes roles or a subsidiary gets added, your visual automatically reflects it. No manual updates, no stale slides.
4. Visualize Multi-Level Account Hierarchies to Understand Enterprise Accounts
Large enterprise accounts often have complex parent-subsidiary structures that are impossible to grasp from a flat list view. Missing this context means you could be managing a subsidiary relationship while completely overlooking the parent account's strategic potential.
Tip: Use the Tree View to render the full Dynamics 365 account hierarchy across N levels. Navigate up to parent accounts or drill down to subsidiaries, all from one visual relationship view, to get the complete picture of an enterprise account structure.
5. Use Visual Legends to Identify Relationship Types at a Glance
When your relationship graph in Dynamics 365 shows dozens of nodes, visual noise becomes a real problem. Without clear differentiation, every connection looks the same.
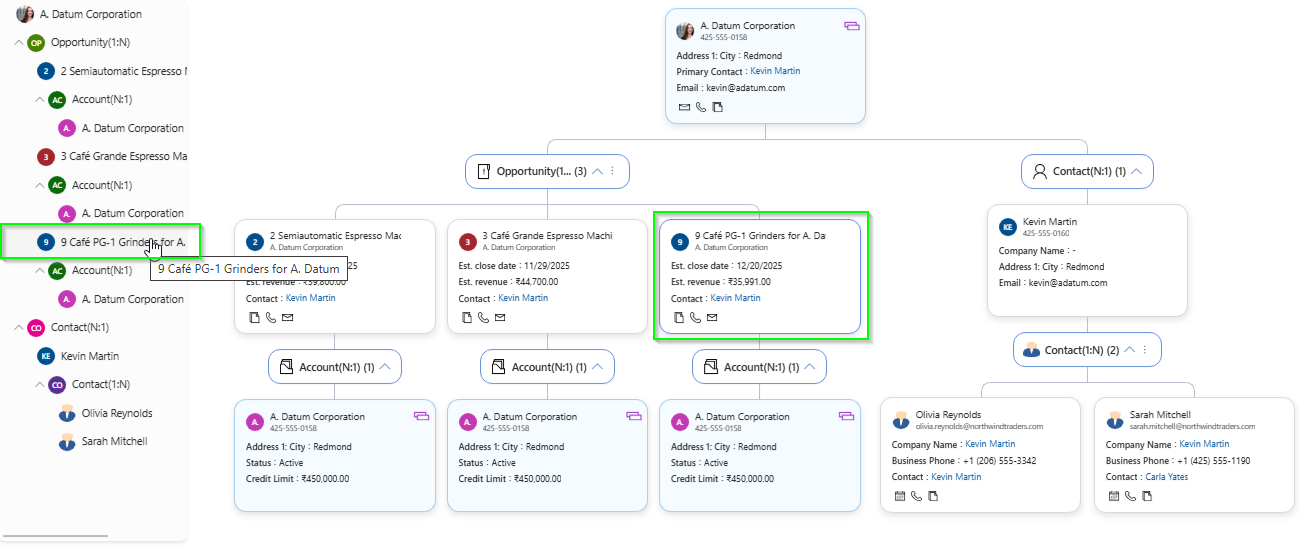
Tip: Apply visual legends to instantly distinguish relationship types. Color-coded edges combined with a legend make your Dynamics 365 relationship chart scannable in seconds, useful during account reviews, team handovers, or when a new rep inherits a complex account.
6. Filter Your Relationship Map to Focus on What Matters
Not every relationship is relevant to every conversation. A crowded map with all connections visible can obscure the insights you actually need.
Tip: Use dropdown view filters to narrow your Dynamics 365 relationship view to only the connections that matter for a specific context. Filter by entity type, relationship role, or record status to build focused, purpose-specific maps, like a pre-renewal stakeholder view or a deal-specific contact map.

7. Act on Relationships Without Leaving the Map
The biggest friction in CRM workflows is context-switching, spotting a relationship insight, and then having to navigate away to act on it. Every tab switch breaks momentum.
Tip: Create tasks, emails, phone calls, and appointments directly from your visual relationship map in Dynamics 365. Activities auto-link to the right record. You stay in the relationship view; the CRM data stays accurate.
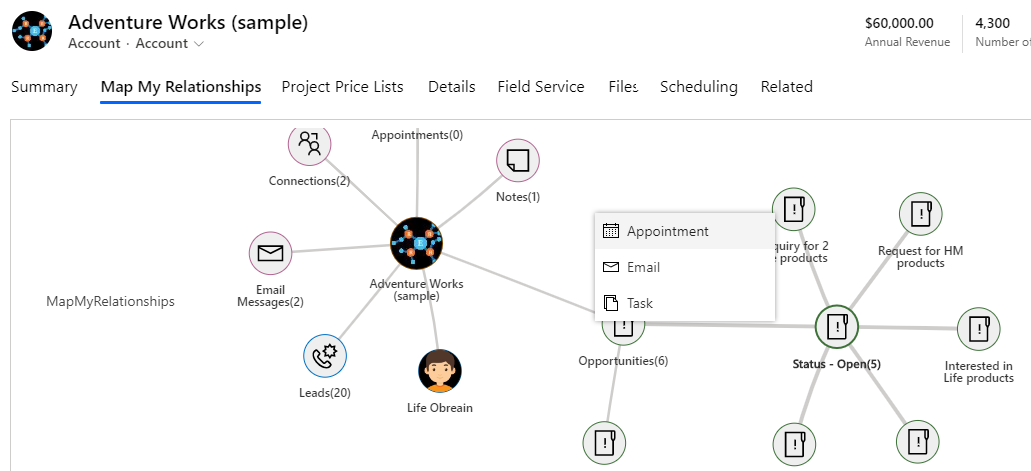
8. Use Spider View to Manage High-Density Relationship Nodes
Some records, a key partner, a major account, a senior executive, connect to dozens of other records. Displaying all those connections in a standard map creates visual chaos that defeats the purpose of visualization.
Tip: Switch to Spider View to group multiple relationships into a single node for high-connectivity records. This gives you a cleaner, more legible Dynamics 365 data visualization that accurately represents relationship density without overwhelming the map.

9. Share Relationship Maps as Visuals Across Your Team
Relationship intelligence is only useful if it's shared. Most CRM relationship data stays locked inside individual rep views, invisible to the broader team during planning sessions or leadership reviews.
Tip: Download your Dynamics 365 relationship map as an image with a single click and embed it directly in account plans, QBR decks, or handover documents. A shared visual ensures everyone, from sales to customer success to leadership, operates from the same relationship context.
10. Keep Your Relationship Data Fresh by Managing Connections from the Map
Stale CRM data undermines every visualization built on top of it. If contacts go unlinked or connections go unupdated, your relationship maps become misleading rather than helpful.
Tip: Use the centralized connection management interface in Map My Relationships to create, update, and delete CRM connections directly from the relationship view in Dynamics 365, without switching screens. When data changes, update it in the same moment you spot it, while the map is in front of you.
The Bottom Line
CRM data visualization and relationship mapping aren't just about making your CRM look better, they're about making it work better. When your team can see account hierarchies, stakeholder networks, and connection patterns at a glance, they make faster decisions, engage the right people, and close deals with more confidence.
Map My Relationships brings all of this into Dynamics 365, natively, visually, and without leaving your CRM.
Start your 15-day free trial from the Inogic website or Microsoft Marketplace. If you want strategic demo aligned with your business scenarios, reach us at [email protected].